skip to main
|
skip to sidebar
Kari's Blog
Blog Archive
Blog Archive
May (1)
June (8)
July (33)
August (8)
Wednesday, July 29, 2009
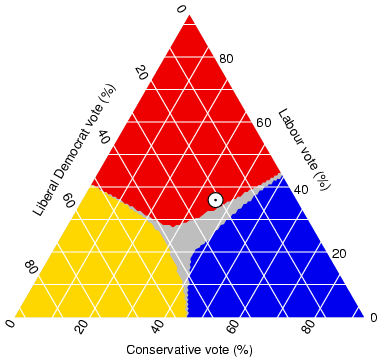
Triangular Plot
A triangular plot such as the one seen above, plots three seperate variables in order to find a common plot between them. This map is showing three different types of votes, and the gray area is where all three merge.
http://www.ex-parrot.com/~chris/images/20050407/triangle.png
No comments:
Post a Comment
Newer Post
Older Post
Home
Subscribe to:
Post Comments (Atom)

No comments:
Post a Comment